If you work on Android apps, you know this moment. One screen feels slow, or someone says the app drains the battery, and you need numbers. The Android Studio profiler can give you numbers, but it is heavy, it wants a debuggable or profileable build, and it’s not something you run in CI. So most of us end up with adb shell top in one terminal and dumpsys meminfo in another, and we try to remember what the number was one minute ago.
adbtop started as an 810 line bash script called monitor_power.sh. It took a package name and a duration, and it wrote a CSV row every 10 seconds for long battery tests. Every new metric was one more adb shell call and one more awk. In April I rewrote it in Rust with a terminal UI. Then I rewrote it again, because I wanted the same numbers in CI and for AI coding agents, not only on my screen.
Short answer: adbtop is a Rust program on your computer. It keeps a few adb shell sessions open, reads /proc, /sys and dumpsys on a schedule, and turns the text into numbers and charts. For network traffic there is a small Android app that works like a local VPN: the app’s packets go through it, it sends them to the real network itself, and it counts everything. No root, no SDK in your app, and nothing goes to any server.
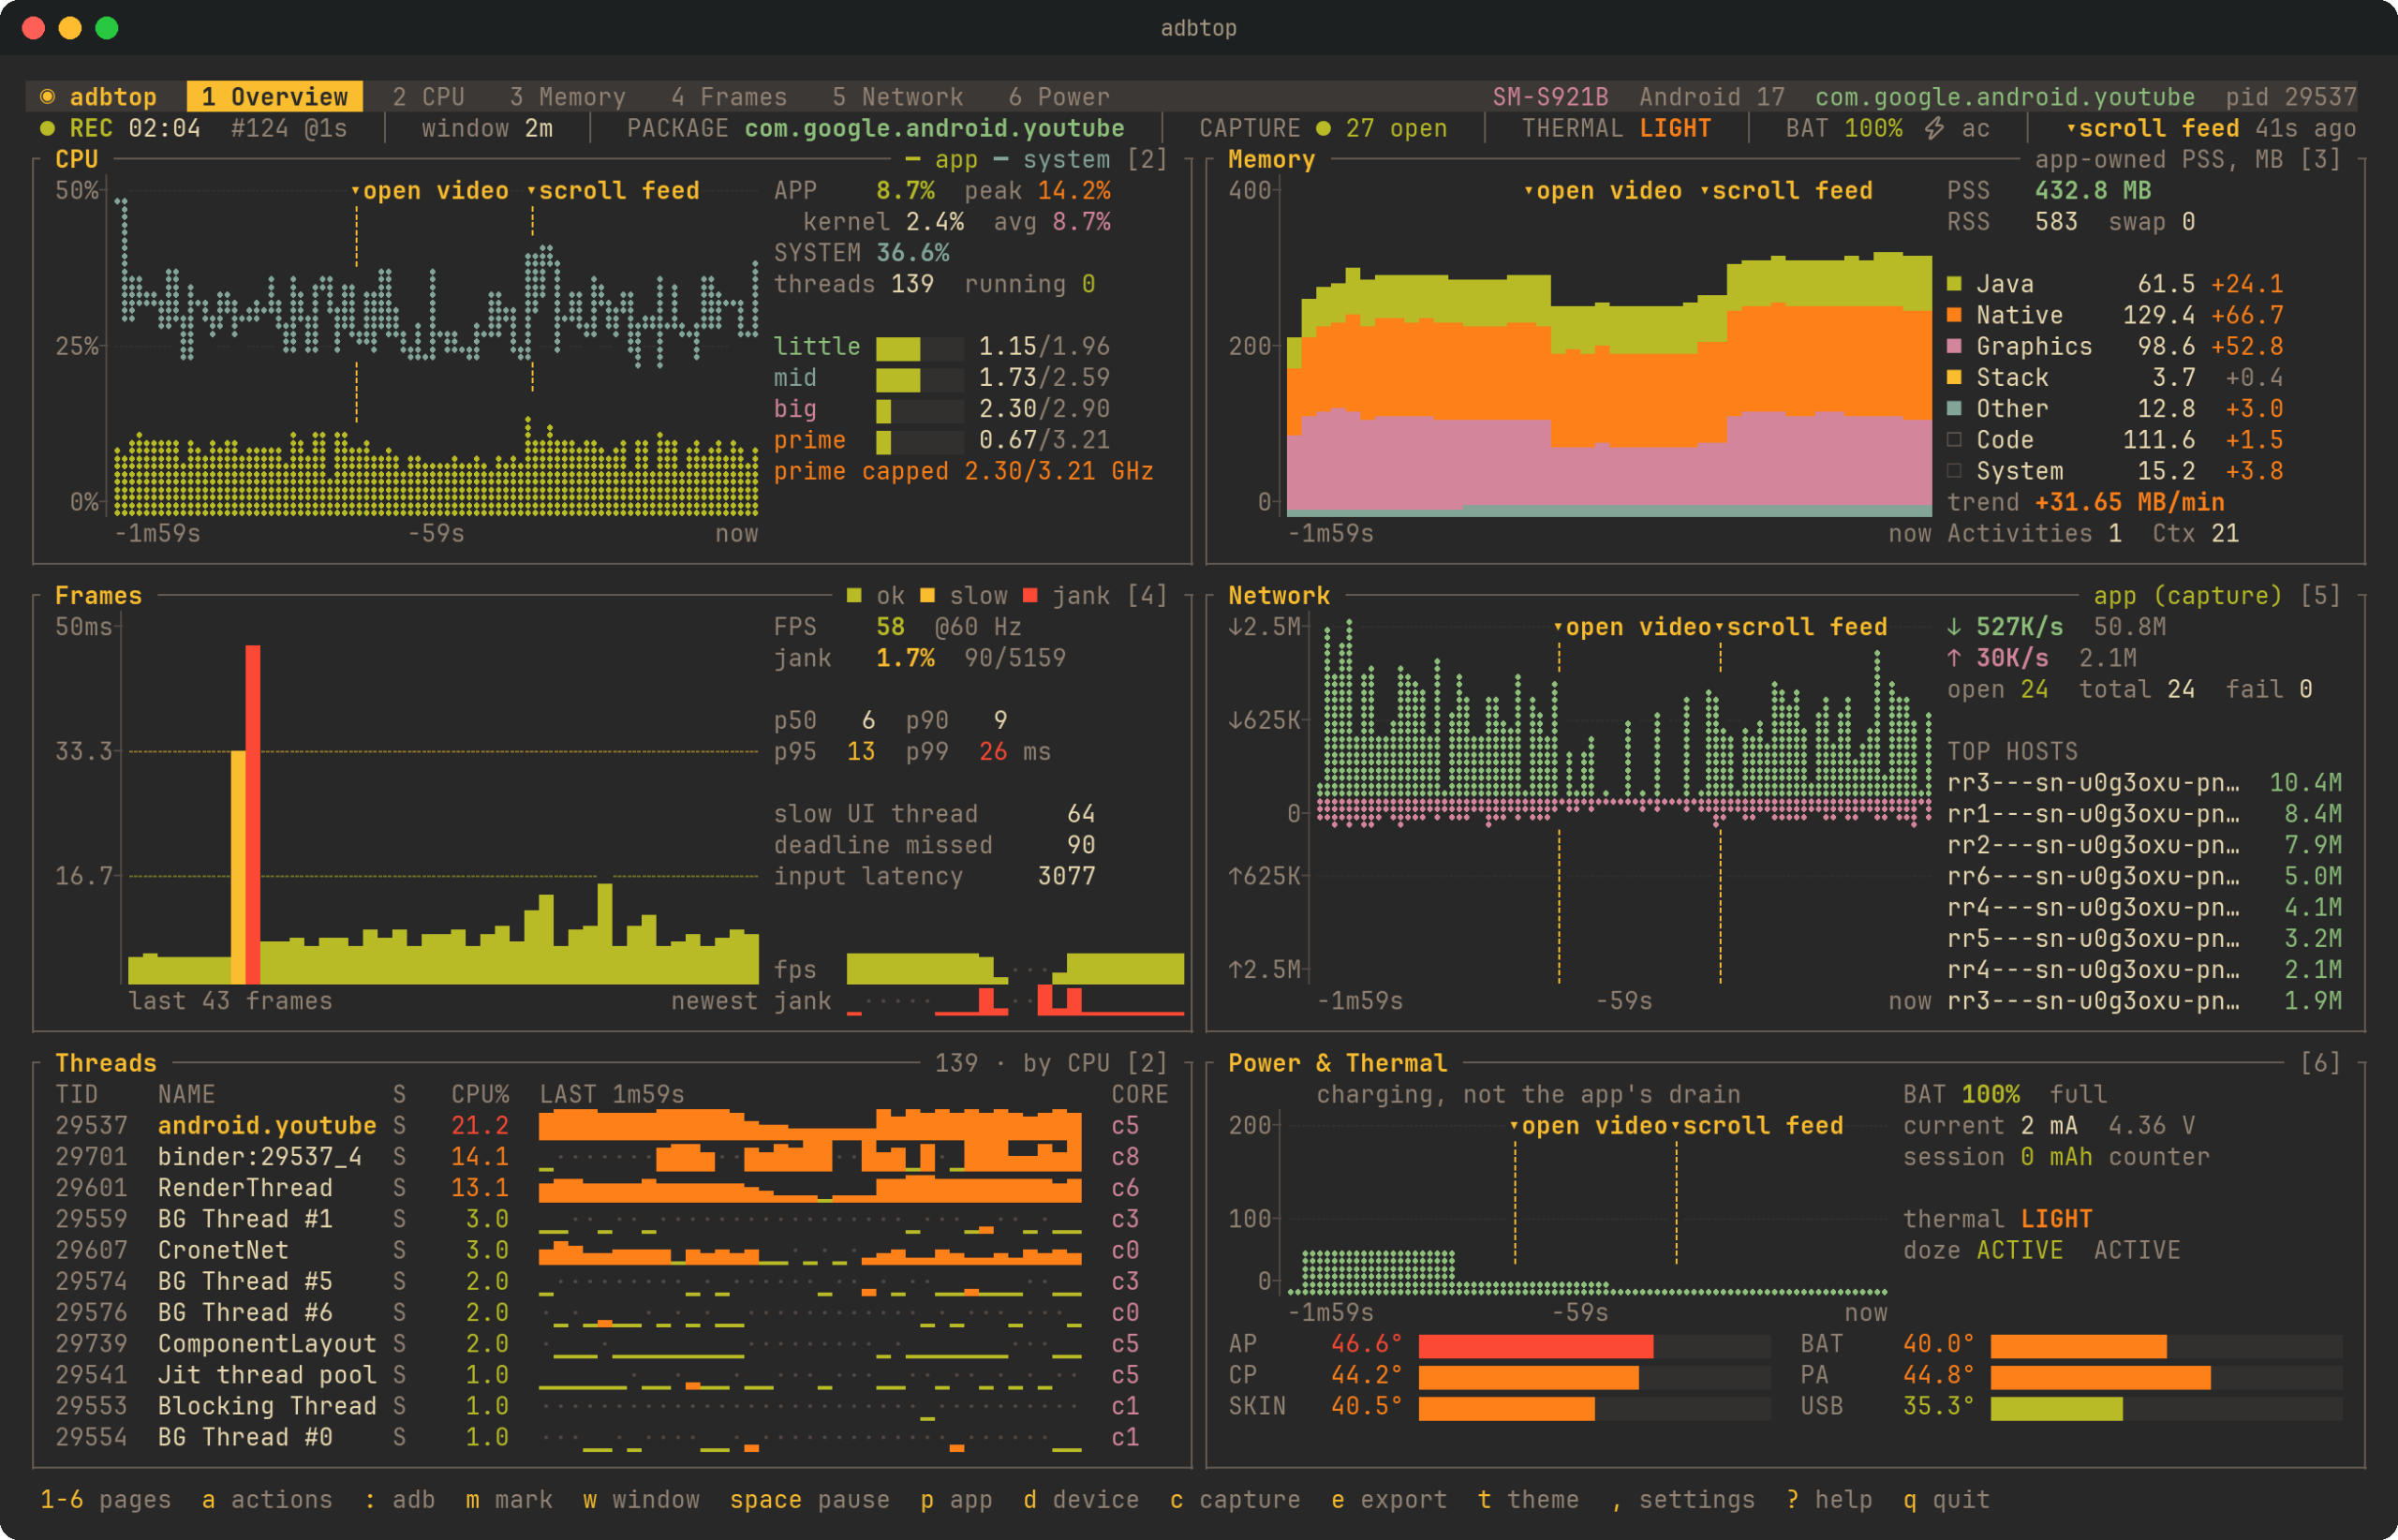
The big picture
There are two programs. The main one is the Rust binary on your computer. The second one is the agent, a small Android app, and you only need it for network traffic. Everything else comes from things every Android phone already has.
On the computer there are a few collectors. Each one is a tokio task with its own adb shell, its own schedule and its own parser. They don’t draw anything and they don’t know about each other. They only send Update messages into one channel.
The Session reads that channel and keeps the state: ring buffers with 15 minutes of history, the recent frames, every thread, the network capture, the markers. The terminal UI draws the session, and the headless commands write it as JSON or CSV. The rule I kept from the first day: the UI never talks to the phone. If a panel needs a new number, a collector has to bring it.
This is normal design, nothing special. But it paid back later. The TUI and the CLI share all the parsing and all the math, so when I fixed the FPS bug (more on it below), both of them got the fix at once.
One shell, many commands
The simple way to read a file from the phone is adb shell cat /proc/stat. That starts a new adb process on your computer, opens a new stream to the phone and starts a new shell there. For one command it’s fine. For six commands every second, for minutes, it’s a lot of processes, and their start time ends up inside every sample. I didn’t benchmark this carefully, so I won’t give you a number.
So each collector opens one adb shell and keeps it open. It writes commands to stdin and reads stdout. The problem is: how do you know where the output of one command ends? The shell doesn’t tell you.
The answer is an old trick. After every command I send an echo with a marker, and I read until a line ends with that marker.
let script = format!("{}\necho '{END_MARKER}'\n", command.trim());
stdin.write_all(script.as_bytes()).await?;
stdin.flush().await?;
loop {
    let start = buf.len();
    if reader.read_until(b'\n', buf).await? == 0 {
        return Err(anyhow!("adb shell exited"));
    }
    let line = trim_newline(&buf[start..]);
    if line.ends_with(marker) {
        let keep = start + line.len() - marker.len();
        buf.truncate(keep);
        return Ok(String::from_utf8_lossy(buf).into_owned());
    }
}
It’s ends_with, not ==. If the output doesn’t end with a newline, the marker is printed on the same line as the last bit of output, and you still want that bit. The marker is ___ADBTOP_END_7f3a___, ugly on purpose, so no real output contains it.
The shell also dies sometimes. The cable moves, the phone goes back to unauthorized, adb restarts. Every command has a 15 second timeout. When something fails, the task kills the shell, answers every waiting request with the last line adb wrote to stderr (usually the real reason), waits one second and starts a new shell for the next request. The collectors have no reconnect logic at all. They get an error, and the next tick works again.
Reading /proc in one round trip
Most of the fast numbers are in plain files: /proc/stat for CPU, /proc/meminfo for memory, /proc/net/dev for network, and for the app /proc/<pid>/stat, status and one stat file per thread. With a big app this can be more than 100 files every second.
I read all of them with one grep:
grep -HvE '^(intr|softirq) ' \
  /proc/uptime /proc/stat /proc/meminfo /proc/net/dev /proc/pressure/memory \
  /proc/$P/stat /proc/$P/status /proc/$P/task/*/stat 2>/dev/null
-H puts the file name in front of every line, so one output can be split back into files on the computer. -v '^(intr|softirq) ' drops two lines of /proc/stat with hundreds of numbers I don’t need. And 2>/dev/null matters, because threads die between the glob and the read all the time.
The pid comes from pidof -s only when I don’t know it yet. After that it stays in the command. Every sample also reads the start time of the process (field 22 of stat). So if the app crashes and comes back, with a new pid or even with the same one, adbtop sees a new process and doesn’t subtract the CPU time of the old process from the new one.
CPU is all deltas. /proc/stat counts ticks since boot, so CPU usage is the change in busy ticks divided by the change in all ticks between two samples. The app is the same idea with utime and stime of its process, and every thread with its own stat. One thing to know: app and system CPU are a share of all cores (100 means every core is busy), but threads are a percent of one core. Two scales, so the docs say it clearly.
Different data, different speeds
Not every number is cheap. Reading /proc costs almost nothing. dumpsys meminfo <package> is another story: the system asks the app process itself for its memory stats, and it takes much longer. If it was in the same loop as CPU, every slow meminfo would delay the CPU sample, and you would see it in the chart.
So every collector has its own shell and its own speed:
The fast loop (CPU, threads, system memory, network) and the frames loop run at the sample interval, 1 second by default. App memory runs every 2 seconds. Everything else is in one slow loop with a 1 second ticker and a counter: ps every 5 seconds, battery on even seconds, thermal on odd seconds, Doze and standby bucket every 5 seconds, jobs and alarms every 10. The offsets are on purpose, so there is no second where all of them run together.
The tickers use tokio’s MissedTickBehavior::Delay. If a command takes longer than the interval, the next tick waits, instead of firing a few ticks in a row to catch up. Catching up makes no sense for a monitor. Three samples 5 ms apart don’t tell you anything new.
“Not supported” is a value too
Android phones are all a bit different. Some kernels have no /proc/pressure. Some phones don’t let you read the cpufreq files. dumpsys thermalservice has no thermal status before Android 10, and frame stats need Android 6.
So the first thing adbtop does is one probe command. It reads getprop for the SDK and the model, the max frequency and related_cpus of every core (that’s how I find the CPU clusters), runs service check for every service I use, tries to read PSI and cpufreq, and asks for the page size (some new phones use 16 KB pages, and RSS is counted in pages). The result goes into a tokio watch channel, and the other collectors wait for it before they start.
Then every source gets a state: supported, or not supported with a reason. The panel shows the reason, for example “the kernel has no /proc/pressure (PSI)”. Before this, a missing metric was just a chart at zero. But zero is a real value. A phone with no memory pressure and a phone that can’t tell you should not look the same.
One session, two front ends
The TUI loop is a tokio::select! over three things: key events, updates from the collectors, and a 500 ms clock. Any of them marks the screen dirty, and the screen is drawn at most once every 33 ms. Updates come in bursts, because all collectors tick at around the same time. Without the limit it would draw almost the same screen several times in a row.
Pause was a small puzzle. When you pause, you want a frozen picture. But if collection stops too, the first delta after resume covers the whole pause, and that time is lost. So pause clones the session. The UI keeps drawing the frozen one, and the collectors write into the copy. Resume swaps the copy in.
The same session works without any UI. adbtop record collects until you stop it and prints a JSON report: averages, peaks, percentiles, memory growth per minute, jank causes. --samples run.csv streams one line per sample. --assert 'frames.janky_pct < 5' exits with code 3 when a check fails, so a CI job can fail on a regression.
To measure one action, you start a recording, then send markers and stop it from a second terminal:
adbtop record -p com.example.app -o run.json
adbtop mark "opened settings"
adbtop stop
There is no daemon. record listens on a random port on 127.0.0.1 and writes a small file with that port into the temp folder. mark and stop read the file and send one line. The report then has its own section for the 15 seconds after every marker.
Every command prints JSON or CSV and nothing else, even errors: {"error":{"code":"no_device",...}}. This is what makes it usable for AI coding agents. adbtop skill install adds a skill to Claude Code and Codex, so you can ask something like “measure the memory of this app while I open settings”, and the agent knows which commands to run and how to read the report.
Network: a VPN that goes nowhere
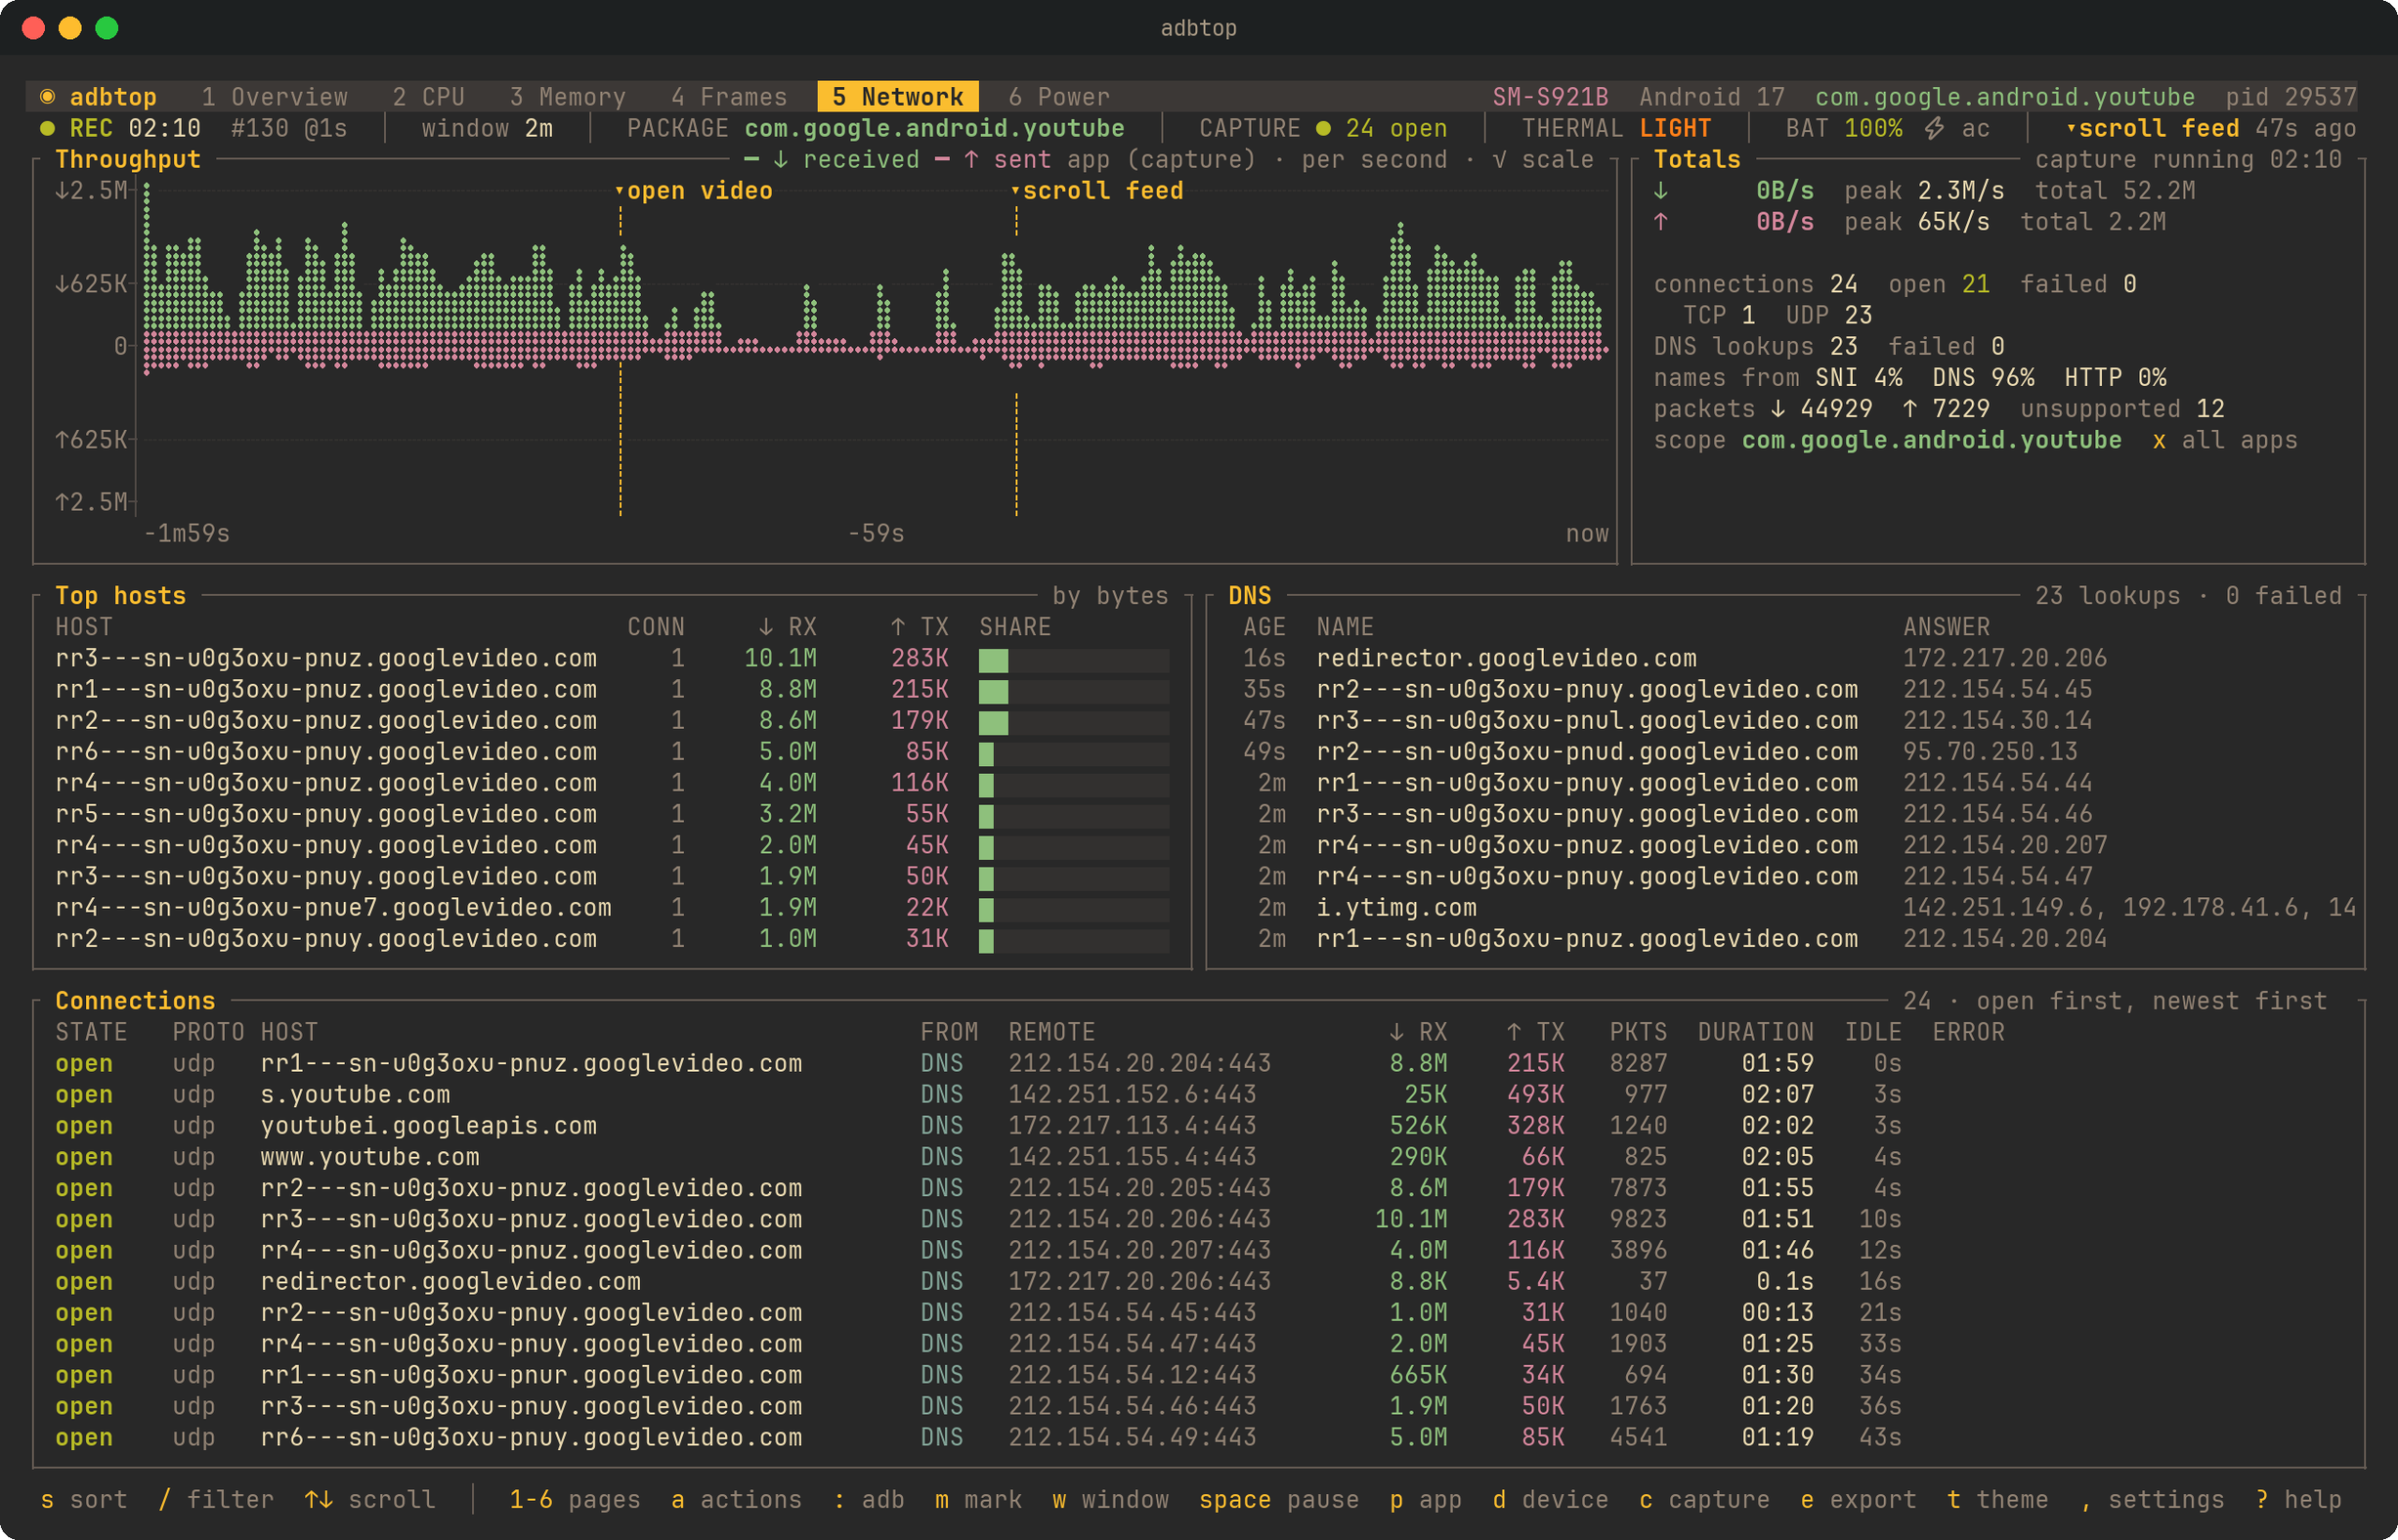
/proc/net/dev gives you bytes per interface for the whole phone. Useful, but it can’t tell you which app sent them, to which host, or why a connection failed. For that you need the packets. And without root, Android has one public way to see the packets of other apps: VpnService.
So the agent is a VPN app, but there is no VPN server. It creates the TUN interface like any VPN, reads every IP packet the app sends, sends the data to the real network itself, and counts everything on the way. Nothing leaves the phone that the app didn’t send anyway.
Builder()
    .setSession("adbtop agent")
    .setMtu(1500)
    .addAddress("10.215.173.1", 30)
    .addRoute("0.0.0.0", 0)
    .addDnsServer("10.215.173.2")
    .setBlocking(false)
    .setMetered(false)
Some details here are not obvious:
addAllowedApplication(pkg)limits the VPN to the app you measure. Without a package, every app goes through it except the agent itself.setMetered(false), because otherwise Android treats every network as metered while the VPN is up. Apps can behave differently on a metered network, and then you measure a different app.- DNS goes to a fake server address,
10.215.173.2. The agent answers it withDnsResolver.rawQuery()on the real network, so the phone’s own resolver and its Private DNS setting still apply. If the lookup fails, the app gets aSERVFAILbuilt from its own query.
The engine has two threads. One reads the TUN device and puts packets into a queue. The queue holds at most 8192 packets; after that, packets are dropped and TCP sends them again. The other thread owns all connection state: a NIO selector, a timer every 100 ms and a snapshot every second. Because only one thread touches the flows, the flow code has no locks at all. Every packet is also handled inside a try/catch, so a bug in one connection is a log line, not a dead network for the whole phone.
To know which app sent a packet, the agent asks ConnectivityManager.getConnectionOwnerUid(). Only the app that owns the active VPN may call it. For once, being a VPN is useful. The host name comes from the TLS ClientHello (SNI), the Host header of plain HTTP, or a DNS answer the agent saw for that IP. It only looks at the first 16 KiB of every connection for this. It doesn’t decrypt anything, and it can’t.
Writing a small TCP in Kotlin
This part took the most time. A VPN gets IP packets, but a normal Android app can’t send raw TCP packets to the internet. It can only open sockets. So the agent can’t just forward a packet. It has to end the app’s TCP connection inside the agent and open a new, normal one to the server. Towards the app, the agent plays the server.
The order matters. The agent doesn’t answer the app’s SYN right away. First it opens a real socket to the server, protected with VpnService.protect() (otherwise the socket goes into the VPN again and loops). Only when the server accepts, the app gets its SYN-ACK. If the server refuses, the app gets a RST, the same thing it would see without the VPN, and the UI shows the reason, like “Connection refused”.
After that it’s a small TCP: sequence numbers, a receive window, retransmission with a timer from 500 ms up to 8 s, fast retransmit after three duplicate ACKs, out-of-order segments kept until the gap is filled. Most of it is textbook. Some parts are easy to get wrong:
- A duplicate ACK must really be the same ACK. The app counts an ACK as a duplicate only if the window didn’t change. If the agent repeats the ACK but with the new free space in the window, the app doesn’t resend the lost segment. It waits for its own timeout, and that timeout doubles every time. So when a segment is missing, the agent repeats the last ACK with the last window.
- Empty segments from the past need an answer. A keepalive and a zero window probe both look like an empty segment with an old sequence number. Ignore them, and the app drops the connection (keepalive) or waits forever (probe).
- The window stays under 64 KiB. With a 65535 byte window there is no window scaling, and that’s one option less to get wrong.
- Packets for unknown connections get a RST. When the agent restarts, apps still have connections it doesn’t know about. A RST makes them reconnect now, instead of waiting for a timeout.
UDP is much simpler: one socket per flow, closed after 2 minutes without traffic. ICMP and IP fragments are not forwarded. They are only counted as “unsupported” in the stats.
Talking to the agent
The agent listens on two abstract unix sockets on the phone: adbtop-agent for stats and adbtop-agent-pcap for packets. On the computer, adbtop runs adb forward tcp:0 localabstract:adbtop-agent, which picks a free local port, and connects to it. If an earlier run left a forward behind, it finds it in adb forward --list and uses it again.
Every second the agent sends one Snapshot: traffic per app, open and recently closed connections, DNS lookups and a few counters. It’s protobuf, length-delimited (a varint size, then the message). The same .proto file is used on both sides. Rust compiles it in build.rs with prost and protox, so you don’t need protoc installed, and the agent uses protobuf-lite.
If the computer is slow to read, the agent doesn’t queue snapshots. Every client has one slot, and a new snapshot replaces the old one. For a live monitor, only the newest snapshot matters.
The pcap socket streams every packet in pcap format, so --pcap capture.pcap gives you a file you can open in Wireshark. Packet times have microsecond resolution (from System.nanoTime()), because milliseconds are too coarse for TCP timing.
Starting the capture needs an Activity, because VpnService.prepare() wants one for the permission dialog. So adbtop runs am start on an invisible ControlActivity with the package name as an extra. The first time, Android shows the VPN dialog on the phone, and you accept it once.
Is this safe?
An app that sees all your traffic should make you a bit nervous. So this is what it does and doesn’t do:
- Any app on the phone can connect to an abstract unix socket. So the agent checks the peer’s uid on every connection and only serves uid 2000 (
shell, which is whatadb forwardconnects as) and root. Everything else is closed and logged. - It doesn’t decrypt TLS. The SNI it reads is plain text in the ClientHello anyway.
- It sends nothing anywhere. Snapshots and pcap go only to the adb sockets.
- It stops itself. If no adbtop is connected for 30 seconds, the capture stops and the VPN goes down. A forgotten VPN changes the network of the whole phone, so it should not live longer than your session.
Bugs that made me doubt every chart
Getting the numbers was the easy part. Most of my time went to bugs where the number looked fine and was wrong. These are the ones I remember best.
122 FPS on a 60 Hz screen
On a 60 Hz phone, adbtop showed 61 FPS, then 61, then 122, then 0. A 60 Hz screen can’t do 122, so the bug was mine.
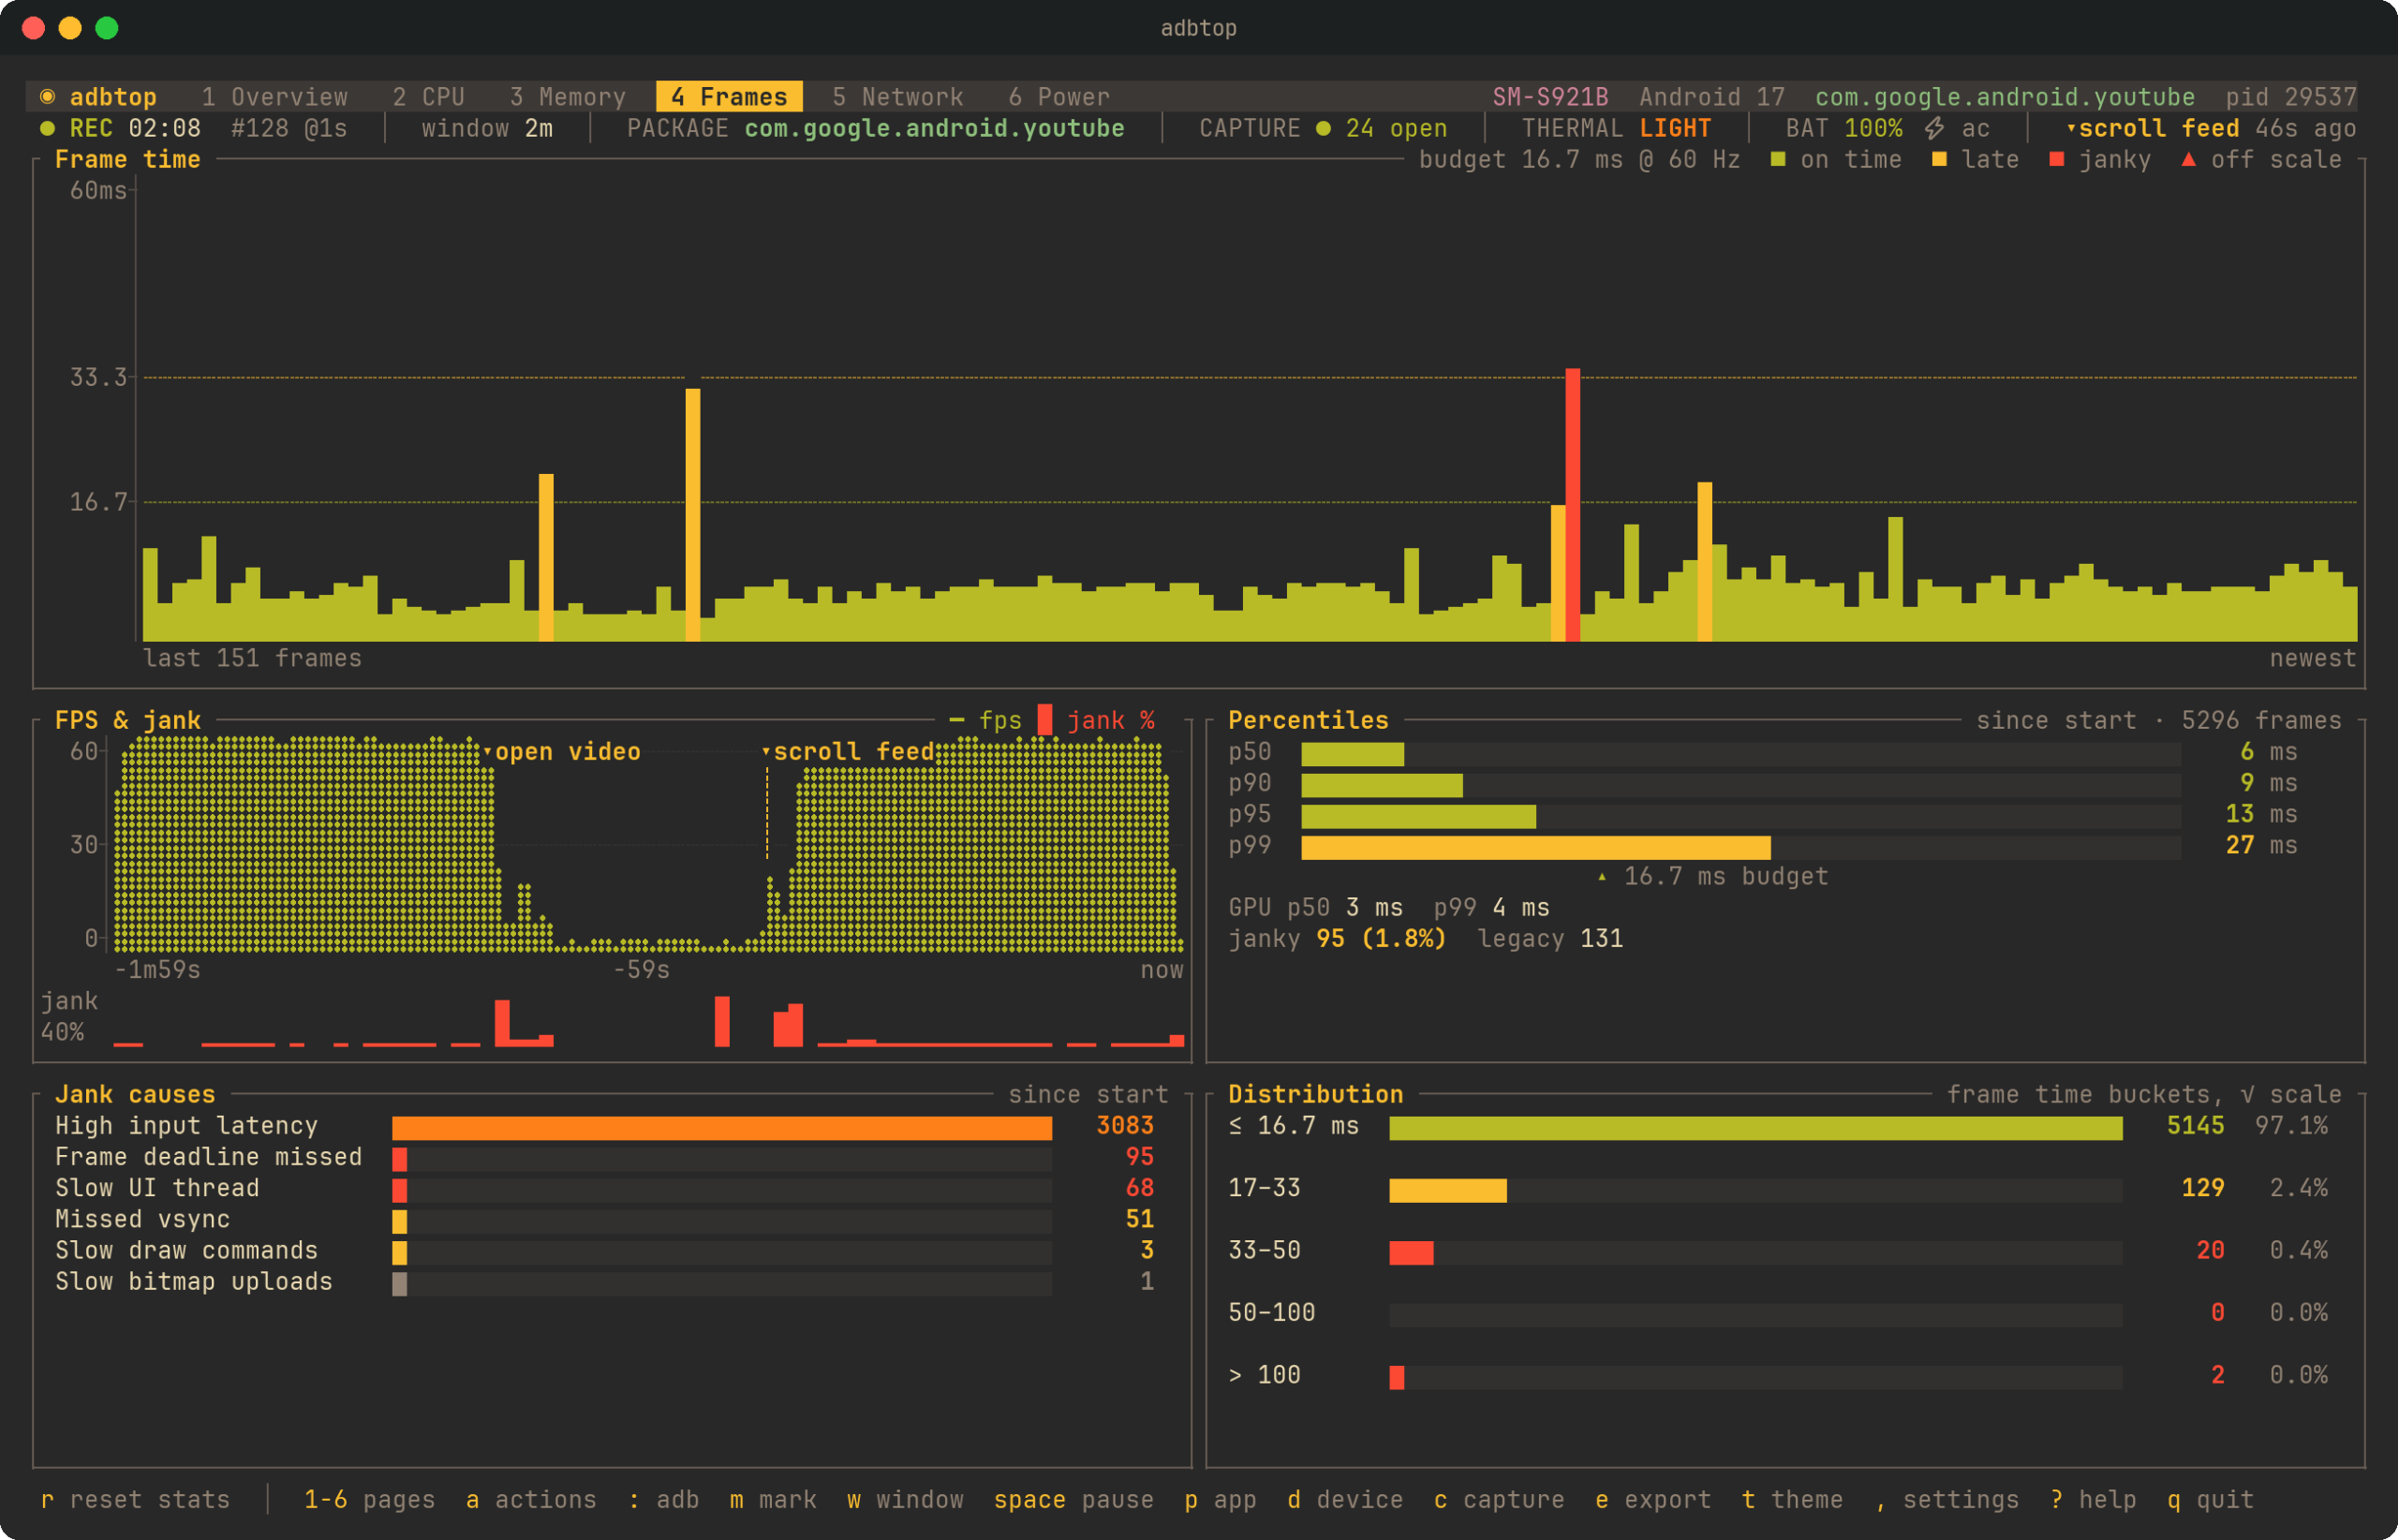
Frames come from dumpsys gfxinfo <package> framestats. The first version counted the new frames in every frames batch and divided them by the time of the CPU loop. Two loops, two shells, both “every second”. But they don’t tick at the same moment, and one slow command moves one of them. So sometimes two frame batches landed inside one CPU second (122), and the next second got nothing (0).
The fix was to stop mixing clocks. gfxinfo has a counter, “Total frames rendered”, and I read /proc/uptime in the same shell call, right after it:
dumpsys gfxinfo com.example.app framestats; echo ==U; cat /proc/uptimeFPS is now the change of the counter divided by the change of the phone’s uptime. Both numbers come from the phone, from the same moment, so the adb delay doesn’t matter anymore. The per-frame list (it only has the most recent frames) is still used for frame times and jank causes, but not for the rate. On the same phone it now shows 57 to 62 FPS, steady.
A spike that disappeared
The CPU chart keeps 15 minutes at one sample per second, so 900 samples. A terminal chart is maybe 100 columns wide, and with braille characters every column has 2 dots. So every dot is 4 or 5 samples.
The first version used the average of those samples. Average is the natural choice, and it’s wrong for a monitor. A one second spike to 88% becomes a small bump, and the spike is the thing you are looking for. Move your mouse over the chart:
Now every pixel column keeps the minimum and the maximum of its samples, and the chart draws a vertical line between them. The block chart uses the extreme value of every bucket, and the stacked memory chart picks peaks the same way. If the chart hides a spike, you will think there was no spike.
Seconds that didn’t exist
Sometimes adb stalls. The phone is busy, the cable is bad, or one dumpsys takes 4 seconds. The old charts just put the next sample right after the last one. So a chart that said “last 60 s” sometimes showed 64 seconds, and the stall was invisible.
Now, when three intervals or more have passed since the last sample, the session pushes empty samples (NaN) into every series, and the chart draws a gap. The function that does it destructures every field of History, so if I add a new series and forget it there, the code doesn’t compile. It’s a small Rust trick.
The time axis also uses the measured interval now, not the configured one. If you ask for 200 ms and the phone needs 700 ms per sample, the axis says so.
Small lies in labels
Some bugs were tiny, but still wrong: two tick labels drawn over each other, a frame time bucket called “100–100 ms”, an axis label wider than the axis. Each one makes you trust the whole screen a bit less. Now labels that collide are skipped, and labels that don’t fit are not drawn.
How I tested it
The engine runs on Linux. It only talks to two interfaces, TunDevice and Platform. On Android they are the VPN and the system services. In the tests, TunDevice is a real Linux TUN device (opened with JNA) and Platform is a few lines of fake. So real traffic goes through the real engine, with the Linux kernel’s TCP on the other side.
With packet loss. One test wraps the TUN device in a LossyTun that drops 2% of the packets in both directions, then downloads 2 MiB, uploads 512 KiB and checks every byte. On a phone, the path between the app and the agent almost never loses a packet, so this is the only place where the retransmission code really runs.
Both sides read the same file. A Kotlin test writes five snapshots to proto/testdata/snapshots.bin, exactly like the agent sends them. A Rust test reads the same file. If one side changes the format, the other side’s test fails, before any phone is involved.
And then the boring check. After all the chart bugs I stopped trusting my own UI, so I compared it with the phone. I read /proc/stat myself before and after a 20 second recording and computed the CPU by hand. System CPU was 24.5% raw and 24.1% in the report, app CPU 6.8% raw and 7.0% in the report. The two windows are not exactly the same length, so a small difference is expected. Memory, network bytes and temperatures matched too.
CI runs formatting, Clippy and the tests on Linux and macOS, builds with Rust 1.78 (the minimum version I support), and builds the agent.
Shipping one binary
I wanted one install command, and the agent should not be a second download. So the APK is inside the Rust binary. build.rs looks for agent/adbtop-agent.apk, and if it is there, it becomes a byte slice with include_bytes!. adbtop agent install writes it to a temp file and runs adb install. A build without the APK still works, and agent install --apk takes a file.
The agent’s version code comes from the Rust version: major × 10000 + minor × 100 + patch, so 0.2.0 is 200. Gradle reads it from Cargo.toml. This way adbtop knows when the agent on the phone is older than itself, and adbtop agent status can tell you.
Two Android details matter here. An APK signed with my debug key can’t be updated by one signed with the release key; Android refuses it. So agent install --replace uninstalls the old one first. And with R8 on, protobuf-lite needs a keep rule for the generated classes, because it finds their fields by reflection.
The workflow checks that the tag matches the version in Cargo.toml, builds and signs the APK and verifies it with apksigner, then builds four binaries with the APK inside: macOS on Apple Silicon and Intel, and Linux x86_64 and arm64 (static, with musl). Then it creates the GitHub release with checksums, updates the Homebrew formula in my tap, and publishes to crates.io. The first real release failed at the very last step, because crates.io wants a verified email address. Not every bug is in the code.
Try it yourself
- Install it:
brew install aabolfazl/tap/adbtopon macOS, the install script from the README on Linux, orcargo install adbtop. - Turn on USB debugging, connect the phone and check
adb devices. - Run
adbtopand pick an app, oradbtop -p com.example.app. - For network:
adbtop agent install, thenadbtop -p com.example.app --capture. Accept the VPN dialog on the phone once. - For CI:
adbtop record -p com.example.app --duration 60s --assert 'frames.janky_pct < 5'.
Final words
adbtop is mostly text parsing and bookkeeping. Reading numbers from Android was easy. Showing them without lying took most of the time: one clock instead of two, min and max instead of an average, a gap instead of a squeezed axis. If you build something like this, compare it with the raw source at least once. It’s boring, and it finds bugs.
The code is on GitHub, MIT licensed.
— Abolfazl Abbasi
Questions, corrections, and a different way of looking at it are welcome.
— Abolfazl Abbasi
Join the conversation
Questions, corrections, and a different way of looking at it are welcome.